
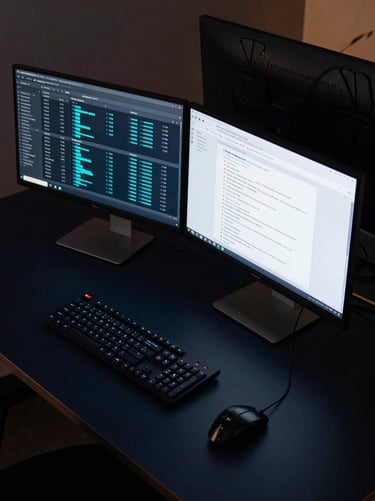

Wide overhead shot of a developer workstation under cool screen glow, two monitors displaying a transaction settlement dashboard with cyan latency metrics and a REST API response window, dark navy desk surface, no warm light
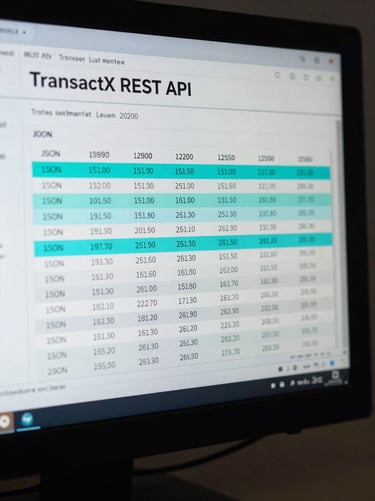
Close-up of a terminal window on a dark monitor showing a TransactX REST API JSON response with settlement timestamps and latency fields highlighted in electric cyan, cool studio strobe lighting, tight crop on the screen surface
Abstract wide shot of server rack infrastructure in a dark data center corridor, cool blue LED ambient lighting, no warm tones, depth of field blurring the far racks, highly technical environment
— Platform Capabilities
/ API & Real-Time Processing
+ Security & Compliance

Every feature ships with a spec, not a promise.

Sub-50ms settlement. No black-box middleware.

Bank-grade encryption. SOC 2 Type II audited.

Sub-50ms settlement latency. Documented REST and webhook API. SOC 2 Type II compliance. Four capabilities, each with numbers your team can verify.

Every settlement call is documented — request schema, response envelope, and webhook retry logic in the public reference. You own the transaction logic; we own the latency.

AES-256 at rest, TLS 1.3 in transit, and a SOC 2 Type II report your security team can read today. No additional compliance engineering required from your side.
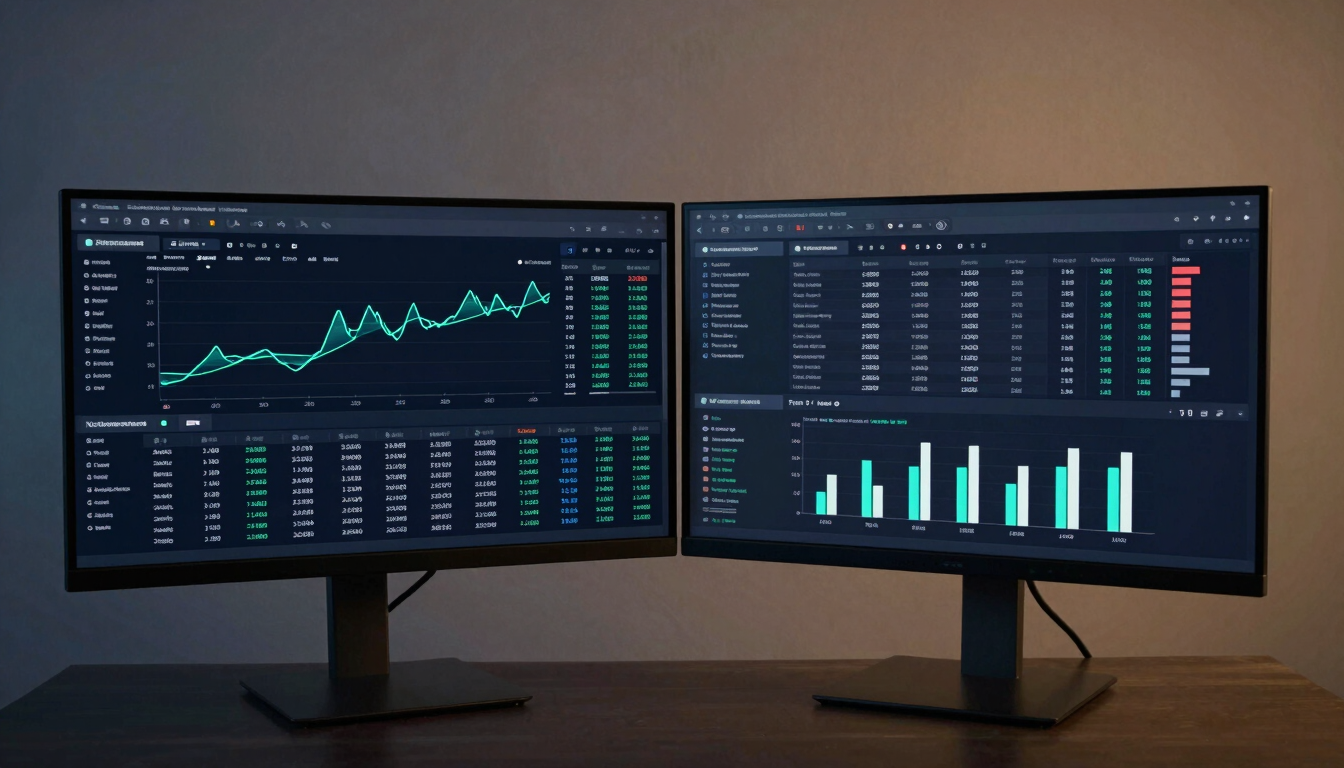

Panoramic wide crop of a transaction analytics dashboard filling two monitors side by side, showing settlement flow timeline charts with cyan accent lines, transaction state breakdown table, failure reason histogram, dark navy UI on screen, cool studio strobe lighting, no warm tones, minimal environment outside the screen
▸ Analytics Dashboard

Transaction states and failure reasons, live.

Settlement timelines, per-transaction state history, and failure reason codes surface in a single dashboard view — no log-diving, no custom queries.

Integration starts with the docs, not a sales call.

The full REST reference, webhook schema, and settlement logic are public. Most teams have a working integration in under two weeks.